Radix sort is a step-wise sorting algorithm that starts the sorting from the least significant digit of the input elements. Like Counting Sort and Bucket Sort, Radix sort also assumes something about the input elements, that they are all k-digit numbers.
The sorting starts with the least significant digit of each element. These least significant digits are all considered individual elements and sorted first; followed by the second least significant digits. This process is continued until all the digits of the input elements are sorted.
Note − If the elements do not have same number of digits, find the maximum number of digits in an input element and add leading zeroes to the elements having less digits. It does not change the values of the elements but still makes them k-digit numbers.
Radix Sort Algorithm
The radix sort algorithm makes use of the counting sort algorithm while sorting in every phase. The detailed steps are as follows −
Step 1 − Check whether all the input elements have same number of digits. If not, check for numbers that have maximum number of digits in the list and add leading zeroes to the ones that do not.
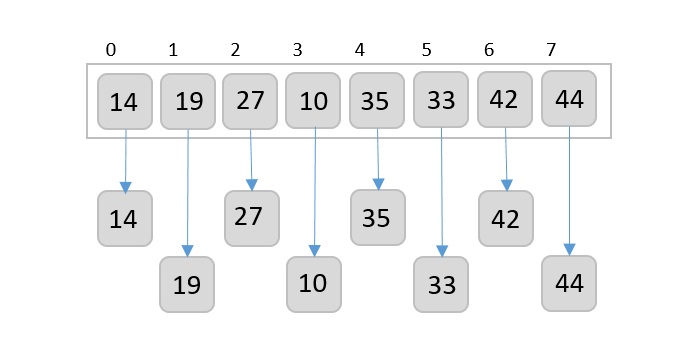
Step 2 − Take the least significant digit of each element.
Step 3 − Sort these digits using counting sort logic and change the order of elements based on the output achieved. For example, if the input elements are decimal numbers, the possible values each digit can take would be 0-9, so index the digits based on these values.
Step 4 − Repeat the Step 2 for the next least significant digits until all the digits in the elements are sorted.
Step 5 − The final list of elements achieved after kth loop is the sorted output.
Pseudocode
Algorithm: RadixSort(a[], n):

   // Find the maximum element of the list
   max = a[0]
   for (i=1 to n-1):
      if (a[i]>max):
         max=a[i]

   // applying counting sort for each digit in each number of
   //the input list
   For (pos=1 to max/pos>0):
      countSort(a, n, pos)
      pos=pos*10
The countSort algorithm called would be −
Algorithm: countSort(a, n, pos)
Initialize count[09] with zeroes
for i = 0 to n:
count[(a[i]/pos) % 10]++
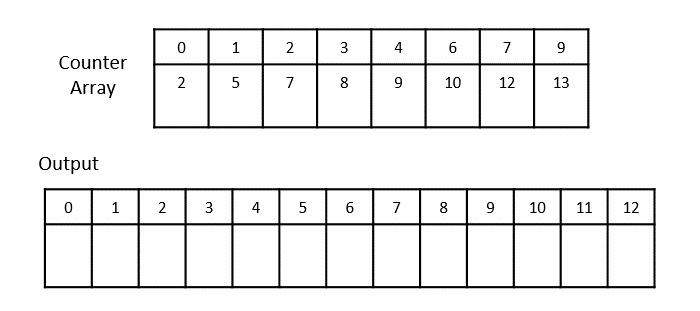
for i = 1 to 10:
count[i] = count[i] + count[i-1]
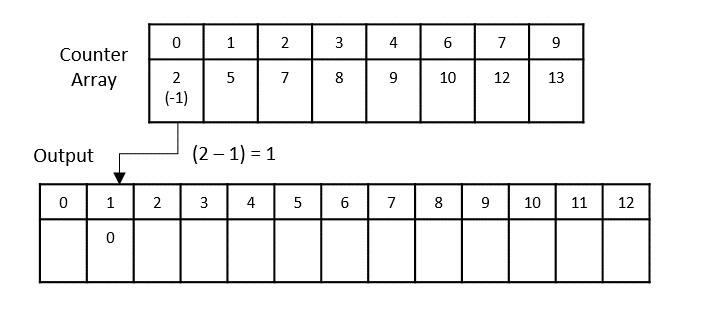
for i = n-1 to 0:
output[count[(a[i]/pos) % 10]-1] = a[i]
i--
for i to n:
a[i] = output[i]
Analysis
Given that there are k-digits in the input elements, the running time taken by the radix sort algorithm would be Θ(k(n + b). Here, n is the number of elements in the input list while b is the number of possible values each digit of a number can take.
Example
For the given unsorted list of elements, 236, 143, 26, 42, 1, 99, 765, 482, 3, 56, we need to perform the radix sort and obtain the sorted output list −
Step 1
Check for elements with maximum number of digits, which is 3. So we add leading zeroes to the numbers that do not have 3 digits. The list we achieved would be −
236, 143, 026, 042, 001, 099, 765, 482, 003, 056
Step 2
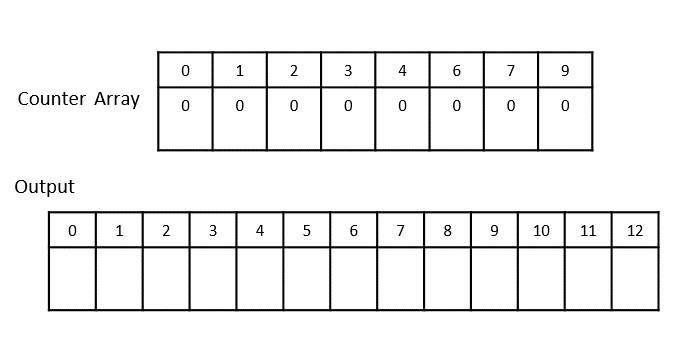
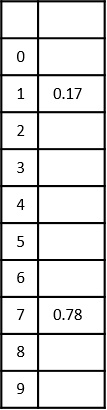
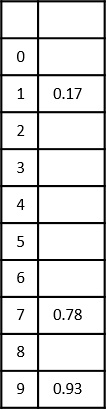
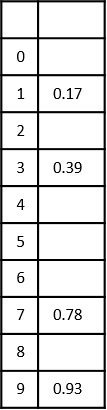
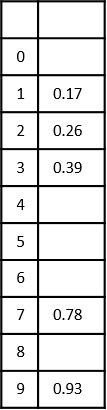
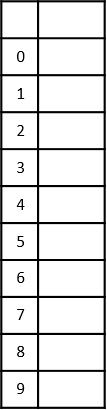
Construct a table to store the values based on their indexing. Since the inputs given are decimal numbers, the indexing is done based on the possible values of these digits, i.e., 0-9.
Step 3
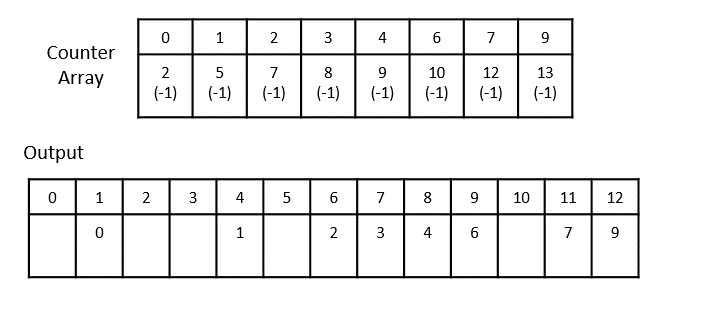
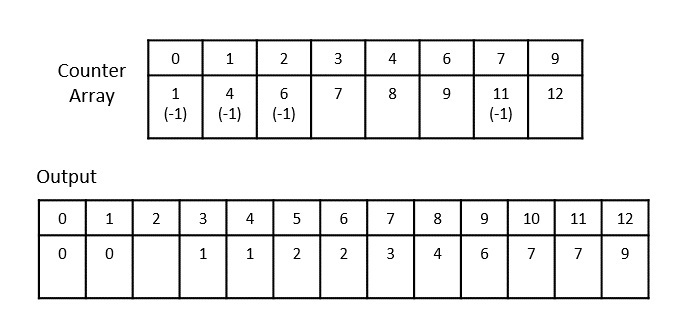
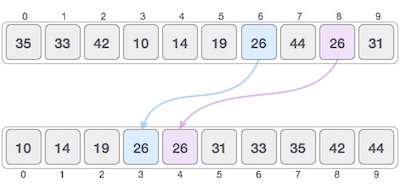
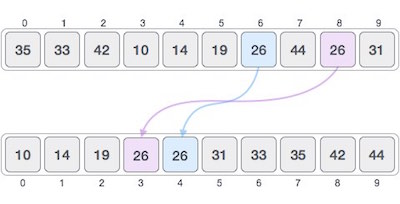
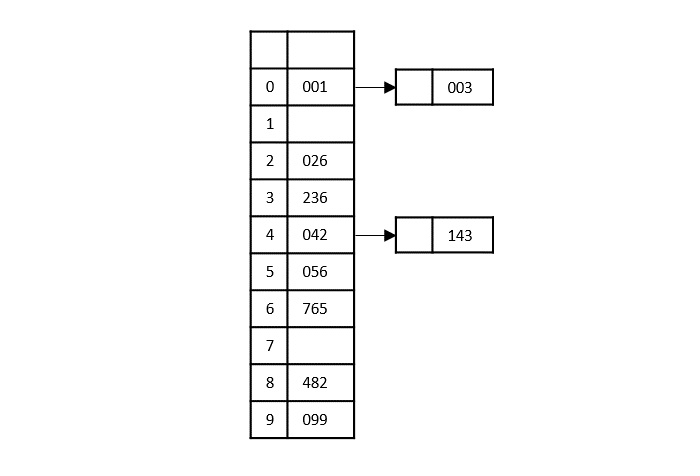
Based on the least significant digit of all the numbers, place the numbers on their respective indices.
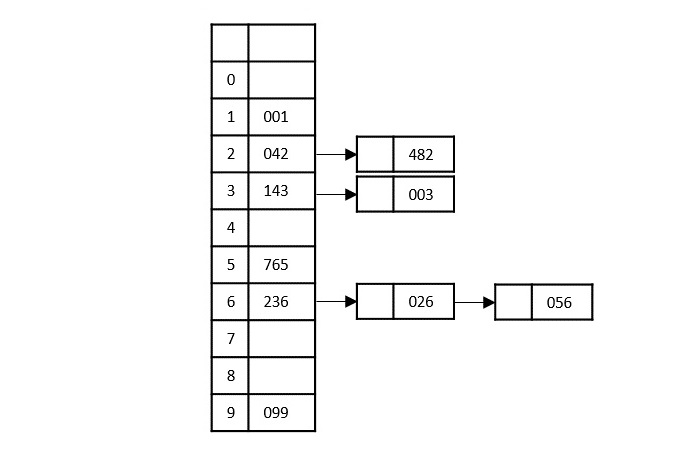
The elements sorted after this step would be 001, 042, 482, 143, 003, 765, 236, 026, 056, 099.
Step 4
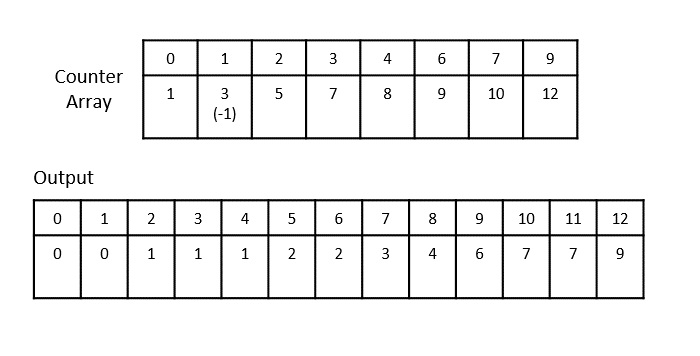
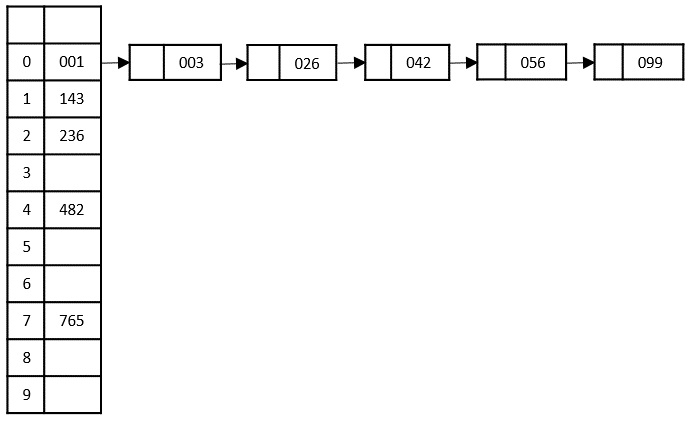
The order of input for this step would be the order of the output in the previous step. Now, we perform sorting using the second least significant digit.
The order of the output achieved is 001, 003, 026, 236, 042, 143, 056, 765, 482, 099.
Step 5
The input list after the previous step is rearranged as −
001, 003, 026, 236, 042, 143, 056, 765, 482, 099
Now, we need to sort the last digits of the input elements.
Since there are no further digits in the input elements, the output achieved in this step is considered as the final output.
The final sorted output is −
1, 3, 26, 42, 56, 99, 143, 236, 482, 765
Implementation
The counting sort algorithm assists the radix sort to perform sorting on multiple d-digit numbers iteratively for d loops. Radix sort is implemented in four programming languages in this tutorial: C, C++, Java, Python.
#include <stdio.h>voidcountsort(int a[],int n,int pos){int output[n +1];int max =(a[0]/ pos)%10;for(int i =1; i < n; i++){if(((a[i]/ pos)%10)> max)
         max = a[i];}int count[max +1];for(int i =0; i < max;++i)
      count[i]=0;for(int i =0; i < n; i++)
      count[(a[i]/ pos)%10]++;for(int i =1; i <10; i++)
      count[i]+= count[i -1];for(int i = n -1; i >=0; i--){
      output[count[(a[i]/ pos)%10]-1]= a[i];
      count[(a[i]/ pos)%10]--;}for(int i =0; i < n; i++)
      a[i]= output[i];}voidradixsort(int a[],int n){int max = a[0];for(int i =1; i < n; i++)if(a[i]> max)
         max = a[i];for(int pos =1; max / pos >0; pos *=10)countsort(a, n, pos);}intmain(){int a[]={236,15,333,27,9,108,76,498};int n =sizeof(a)/sizeof(a[0]);printf("Before sorting array elements are: ");for(int i =0; i <n;++i){printf("%d ", a[i]);}radixsort(a, n);printf("\nAfter sorting array elements are: ");for(int i =0; i < n;++i){printf("%d ", a[i]);}printf("\n");}
Output
Before sorting array elements are: 236 15 333 27 9 108 76 498
After sorting array elements are: 9 15 27 76 108 236 333 498