The K-medoids clustering algorithm can be summarized as follows −
Initialize k medoids − Select k random data points from the dataset as the initial medoids.
Assign data points to medoids − Assign each data point to the nearest medoid.
Update medoids − For each cluster, select the data point that minimizes the sum of distances to all the other data points in the cluster, and set it as the new medoid.
Repeat steps 2 and 3 until convergence or a maximum number of iterations is reached.
Implementation in Python
To implement K-medoids clustering in Python, we can use the scikit-learn library. The scikit-learn library provides the KMedoids class, which can be used to perform K-medoids clustering on a dataset.
First, we need to import the required libraries −
from sklearn_extra.cluster import KMedoids
from sklearn.datasets import make_blobs
import matplotlib.pyplot as plt
Next, we generate a sample dataset using the make_blobs() function from scikit-learn −
X, y = make_blobs(n_samples=500, centers=3, random_state=42)
Here, we generate a dataset with 500 data points and 3 clusters.
Next, we initialize the KMedoids class and fit the data −
from sklearn_extra.cluster import KMedoids
from sklearn.datasets import make_blobs
import matplotlib.pyplot as plt
# Generate sample data
X, y = make_blobs(n_samples=500, centers=3, random_state=42)# Cluster the data using KMedoids
kmedoids = KMedoids(n_clusters=3, random_state=42)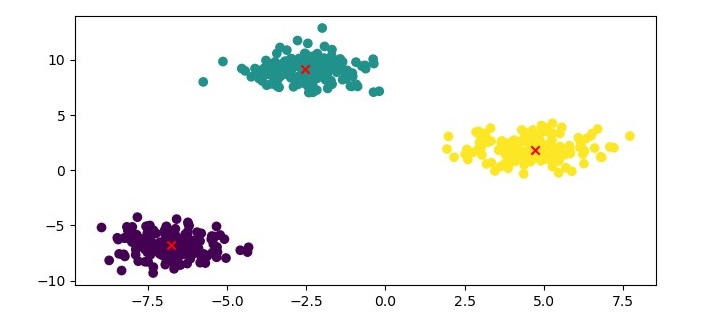
kmedoids.fit(X)# Plot the results
plt.figure(figsize=(7.5,3.5))
plt.scatter(X[:,0], X[:,1], c=kmedoids.labels_, cmap='viridis')
plt.scatter(kmedoids.cluster_centers_[:,0],
kmedoids.cluster_centers_[:,1], marker='x', color='red')
plt.show()
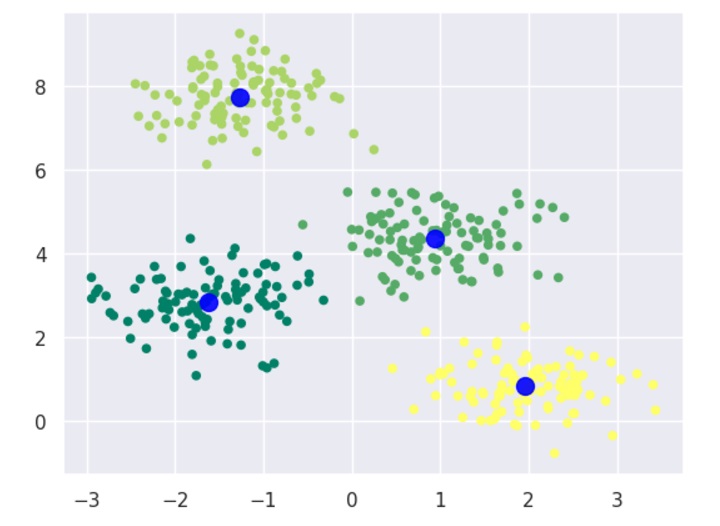
Output
Here, we plot the data points as a scatter plot and color them based on their cluster labels. We also plot the medoids as red crosses.
K-Medoids Clustering – Advantages
Here are the advantages of using K-medoids clustering −
Robust to outliers and noise − K-medoids clustering is more robust to outliers and noise than K-means clustering because it uses a representative data point, called a medoid, to represent the center of the cluster.
Can handle non-Euclidean distance metrics − K-medoids clustering can be used with any distance metric, including non-Euclidean distance metrics, such as Manhattan distance and cosine similarity.
Computationally efficient − K-medoids clustering has a computational complexity of O(k*n^2), which is lower than the computational complexity of K-means clustering.
K-Medoids Clustering – Disadvantages
The disadvantages of using K-medoids clustering are as follows −
Sensitive to the choice of k − The performance of K-medoids clustering can be sensitive to the choice of k, the number of clusters.
Not suitable for high-dimensional data − K-medoids clustering may not perform well on high-dimensional data because the medoid selection process becomes computationally expensive.
K-means clustering algorithm computes the centroids and iterates until we it finds optimal centroid. It assumes that the number of clusters are already known. It is also called flat clustering algorithm. The number of clusters identified from data by algorithm is represented by ‘K’ in K-means.
In this algorithm, the data points are assigned to a cluster in such a manner that the sum of the squared distance between the data points and centroid would be minimum. It is to be understood that less variation within the clusters will lead to more similar data points within same cluster.
Working of K-Means Algorithm
We can understand the working of K-Means clustering algorithm with the help of following steps −
Step 1 − First, we need to specify the number of clusters, K, need to be generated by this algorithm.
Step 2 − Next, randomly select K data points and assign each data point to a cluster. In simple words, classify the data based on the number of data points.
Step 3 − Now it will compute the cluster centroids.
Step 4 − Next, keep iterating the following until we find optimal centroid which is the assignment of data points to the clusters that are not changing any more −4.1 − First, the sum of squared distance between data points and centroids would be computed.4.2 − Now, we have to assign each data point to the cluster that is closer than other cluster (centroid).4.3 − At last compute the centroids for the clusters by taking the average of all data points of that cluster.
K-means follows Expectation-Maximization approach to solve the problem. The Expectation-step is used for assigning the data points to the closest cluster and the Maximization-step is used for computing the centroid of each cluster.
While working with K-means algorithm we need to take care of the following things −
While working with clustering algorithms including K-Means, it is recommended to standardize the data because such algorithms use distance-based measurement to determine the similarity between data points.
Due to the iterative nature of K-Means and random initialization of centroids, K-Means may stick in a local optimum and may not converge to global optimum. That is why it is recommended to use different initializations of centroids.
The K-Means algorithm is a straightforward and efficient algorithm, and it can handle large datasets. However, it has some limitations, such as its sensitivity to the initial centroids, its tendency to converge to local optima, and its assumption of equal variance for all clusters.
Objective of K-means Clustering
The main goals of cluster analysis are −
To get a meaningful intuition from the data we are working with.
Cluster-then-predict where different models will be built for different subgroups.
Implementation of K-Means Algorithm Using Python
Python has several libraries that provide implementations of various machine learning algorithms, including K-Means clustering. Let’s see how to implement the K-Means algorithm in Python using the scikit-learn library.
Example 1
It is a simple example to understand how k-means works. In this example, we generate 300 random data points with two features. And apply K-means algorithm to generate clusters.
Step 1 − Import Required Libraries
To implement the K-Means algorithm in Python, we first need to import the required libraries. We will use the numpy and matplotlib libraries for data processing and visualization, respectively, and the scikit-learn library for the K-Means algorithm.
import numpy as np
import matplotlib.pyplot as plt
from sklearn.cluster import KMeans
Step 2 − Generate Data
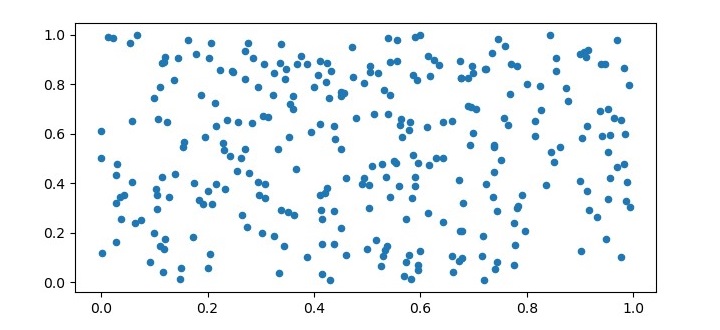
To test the K-Means algorithm, we need to generate some sample data. In this example, we will generate 300 random data points with two features. We will visualize the data also.
X = np.random.rand(300,2)

plt.figure(figsize=(7.5,3.5))
plt.scatter(X[:,0], X[:,1], s=20, cmap='summer');
plt.show()
Output
Step 3 − Initialize K-Means
Next, we need to initialize the K-Means algorithm by specifying the number of clusters (K) and the maximum number of iterations.
kmeans = KMeans(n_clusters=3, max_iter=100)
Step 4 − Train the Model
After initializing the K-Means algorithm, we can train the model by fitting the data to the algorithm.
kmeans.fit(X)
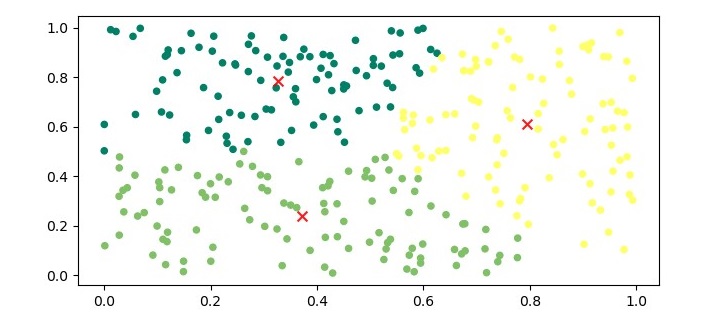
Step 5 − Visualize the Clusters
To visualize the clusters, we can plot the data points and color them based on their assigned cluster.
The output of the above code will be a plot with the data points colored based on their assigned cluster, and the centroids marked with an ‘x’ symbol in red color.
Example 2
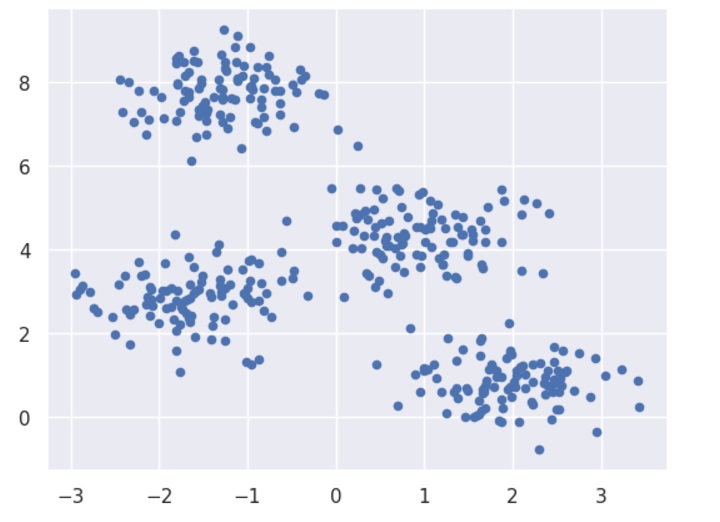
In this example, we are going to first generate 2D dataset containing 4 different blobs and after that will apply k-means algorithm to see the result.
First, we will start by importing the necessary packages −
%matplotlib inline
import matplotlib.pyplot as plt
import seaborn as sns; sns.set()import numpy as np
from sklearn.cluster import KMeans
The following code will generate the 2D, containing four blobs −
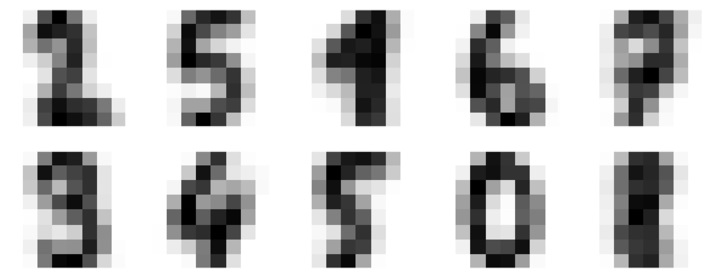
Let us move to another example in which we are going to apply K-means clustering on simple digits dataset. K-means will try to identify similar digits without using the original label information.
First, we will start by importing the necessary packages −
%matplotlib inline
import matplotlib.pyplot as plt
import seaborn as sns; sns.set()import numpy as np
from sklearn.cluster import KMeans
Next, load the digit dataset from sklearn and make an object of it. We can also find number of rows and columns in this dataset as follows −
from sklearn.datasets import load_digits
digits = load_digits()
digits.data.shape
Output
(1797, 64)
The above output shows that this dataset is having 1797 samples with 64 features.
We can perform the clustering as we did in Example 1 above −
As output, we will get following image showing clusters centers learned by k-means.
The following lines of code will match the learned cluster labels with the true labels found in them −
from scipy.stats import mode
labels = np.zeros_like(clusters)for i inrange(10):
   mask =(clusters == i)
   labels[mask]= mode(digits.target[mask])[0]
Next, we can check the accuracy as follows −
from sklearn.metrics import accuracy_score
accuracy_score(digits.target, labels)
Output
0.7935447968836951
The above output shows that the accuracy is around 80%.
Advantages of K-Means Clustering Algorithm
The following are some advantages of K-Means clustering algorithms −
It is very easy to understand and implement.
If we have large number of variables then, K-means would be faster than Hierarchical clustering.
On re-computation of centroids, an instance can change the cluster.
Tighter clusters are formed with K-means as compared to Hierarchical clustering.
Disadvantages of K-Means Clustering Algorithm
The following are some disadvantages of K-Means clustering algorithms −
It is a bit difficult to predict the number of clusters i.e. the value of k.
Output is strongly impacted by initial inputs like number of clusters (value of k).
Order of data will have strong impact on the final output.
It is very sensitive to rescaling. If we will rescale our data by means of normalization or standardization, then the output will completely change.final output.
It is not good in doing clustering job if the clusters have a complicated geometric shape.
Applications of K-Means Clustering
K-Means clustering is a versatile algorithm with various applications in several fields. Here we have highlighted some of the important applications −
Image Segmentation
K-Means clustering can be used to segment an image into different regions based on the color or texture of the pixels. This technique is widely used in computer vision applications, such as object recognition, image retrieval, and medical imaging.
Customer Segmentation
K-Means clustering can be used to segment customers into different groups based on their purchasing behavior or demographic characteristics. This technique is widely used in marketing applications, such as customer retention, loyalty programs, and targeted advertising.
Anomaly Detection
K-Means clustering can be used to detect anomalies in a dataset by identifying data points that do not belong to any cluster. This technique is widely used in fraud detection, network intrusion detection, and predictive maintenance.
Genomic Data Analysis
K-Means clustering can be used to analyze gene expression data to identify different groups of genes that are co-regulated or co-expressed. This technique is widely used in bioinformatics applications, such as drug discovery, disease diagnosis, and personalized medicine.
Centroid-based clustering is a class of machine learning algorithms that aims to partition a dataset into groups or clusters based on the proximity of data points to the centroid of each cluster.
The centroid of a cluster is the arithmetic mean of all the data points in that cluster and serves as a representative point for that cluster.
The two most popular centroid-based clustering algorithms are −
K-means Clustering
K-Means clustering is a popular unsupervised machine learning algorithm used for clustering data. It is a simple and efficient algorithm that can group data points into K clusters based on their similarity. The algorithm works by first randomly selecting K centroids, which are the initial centers of each cluster. Each data point is then assigned to the cluster whose centroid is closest to it. The centroids are then updated by taking the mean of all the data points in the cluster. This process is repeated until the centroids no longer move or the maximum number of iterations is reached.
K-Medoids Clustering
K-medoids clustering is a partition-based clustering algorithm that is used to cluster a set of data points into “k” clusters. Unlike K-means clustering, which uses the mean value of the data points to represent the center of the cluster, K-medoids clustering uses a representative data point, called a medoid, to represent the center of the cluster. The medoid is the data point that minimizes the sum of the distances between it and all the other data points in the cluster. This makes K-medoids clustering more robust to outliers and noise than K-means clustering.
We will discuss these two clustering methods in the next two chapters.
Clustering Algorithms are one of the most useful unsupervised machine learning methods. These methods are used to find similarity as well as the relationship patterns among data samples and then cluster those samples into groups having similarity based on features.
Clustering is important because it determines the intrinsic grouping among the present unlabeled data. They basically make some assumptions about data points to constitute their similarity. Each assumption will construct different but equally valid clusters.
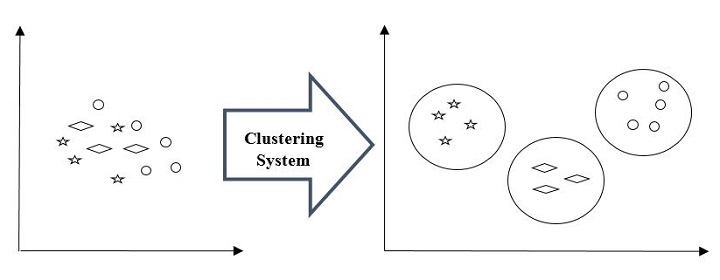
For example, below is the diagram which shows clustering system grouped together the similar kind of data in different clusters −
Cluster Formation Methods
It is not necessary that clusters will be formed in spherical form. Followings are some other cluster formation methods −
Density-based
In these methods, the clusters are formed as the dense region. The advantage of these methods is that they have good accuracy as well as good ability to merge two clusters. Ex. Density-Based Spatial Clustering of Applications with Noise (DBSCAN), Ordering Points to identify Clustering structure (OPTICS) etc.
Hierarchical-based
In these methods, the clusters are formed as a tree type structure based on the hierarchy. They have two categories namely, Agglomerative (Bottom up approach) and Divisive (Top down approach). Ex. Clustering using Representatives (CURE), Balanced iterative Reducing Clustering using Hierarchies (BIRCH) etc.
Partitioning
In these methods, the clusters are formed by portioning the objects into k clusters. Number of clusters will be equal to the number of partitions. Ex. K-means, Clustering Large Applications based upon randomized Search (CLARANS).
Grid
In these methods, the clusters are formed as a grid like structure. The advantage of these methods is that all the clustering operation done on these grids are fast and independent of the number of data objects. Ex. Statistical Information Grid (STING), Clustering in Quest (CLIQUE).
Clustering Algorithms in Machine Learning
The following are the most important and useful machine learning clustering algorithms −
K-Means Clustering
K-Medoids Clustering
Mean-Shift Clustering
DBSCAN Clustering
OPTICS Clustering
HDBSCAN Clustering
BIRCH algorithm
Affinity Propagation Clustering
Agglomerative Clustering
Gaussian Mixture Model
K-Means Clustering
The K-Means clustering algorithm computes the centroids and iterates until we it finds optimal centroid. It assumes that the number of clusters are already known. It is also called flat clustering algorithm. The number of clusters identified from data by algorithm is represented by ‘K’ in K-means.
K-Medoids Clustering
The K-Methoids Clustering is an improved version of K-means clustering algorithm. Working is as follows
Select k random data points from the dataset as the initial medoids.
Assign each data point to the nearest medoid.
For each cluster, select the data point that minimizes the sum of distances to all the other data points in the cluster, and set it as the new medoid.
Repeat steps 2 and 3 until convergence or a maximum number of iterations is reached.
Mean-Shift Clustering
Mean-Shift ClusteringIt is another powerful clustering algorithm used in unsupervised learning. Unlike K-means clustering, it does not make any assumptions hence it is a non-parametric algorithm.
DBSCAN Clustering
The DBSCAN (Density-Based Spatial Clustering of Applications with Noise) algorithm is one of the most common density-based clustering algorithms. The DBSCAN algorithm requires two parameters: the minimum number of neighbors (minPts) and the maximum distance between core data points (eps).
OPTICS Clustering
OPTICS (Ordering Points to Identify the Clustering Structure) is like DBSCAN, another popular density-based clustering algorithm. However, OPTICS has several advantages over DBSCAN, including the ability to identify clusters of varying densities, the ability to handle noise, and the ability to produce a hierarchical clustering structure.
HDBSCAN Clustering
HDBSCAN (Hierarchical Density-Based Spatial Clustering of Applications with Noise) is a clustering algorithm that is based on density clustering. It is a newer algorithm that builds upon the popular DBSCAN algorithm and offers several advantages over it, such as better handling of clusters of varying densities and the ability to detect clusters of different shapes and sizes.
BIRCH algorithm
BIRCH (Balanced Iterative Reducing and Clustering hierarchies) is a hierarchical clustering algorithm that is designed to handle large datasets efficiently. The algorithm builds a treelike structure of clusters by recursively partitioning the data into subclusters until a stopping criterion is met.
Affinity Propagation Clustering
Affinity Propagation is a clustering algorithm that identifies “exemplars” in a dataset and assigns each data point to one of these exemplars. It is a type of clustering algorithm that does not require a pre-specified number of clusters, making it a useful tool for exploratory data analysis. Affinity Propagation was introduced by Frey and Dueck in 2007 and has since been widely used in many fields such as biology, computer vision, and social network analysis.
Agglomerative Clustering
Agglomerative clustering is a hierarchical clustering algorithm that starts with each data point as its own cluster and iteratively merges the closest clusters until a stopping criterion is reached. It is a bottom-up approach that produces a dendrogram, which is a tree-like diagram that shows the hierarchical relationship between the clusters. The algorithm can be implemented using the scikit-learn library in Python.
Gaussian Mixture Model
Gaussian Mixture Models (GMM) is a popular clustering algorithm used in machine learning that assumes that the data is generated from a mixture of Gaussian distributions. In other words, GMM tries to fit a set of Gaussian distributions to the data, where each Gaussian distribution represents a cluster in the data.
Measuring Clustering Performance
One of the most important consideration regarding ML model is assessing its performance or you can say model’s quality. In case of supervised learning algorithms, assessing the quality of our model is easy because we already have labels for every example.
On the other hand, in case of unsupervised learning algorithms we are not that much blessed because we deal with unlabeled data. But still we have some metrics that give the practitioner an insight about the happening of change in clusters depending on algorithm.
Before we deep dive into such metrics, we must understand that these metrics only evaluates the comparative performance of models against each other rather than measuring the validity of the model’s prediction. Followings are some of the metrics that we can deploy on clustering algorithms to measure the quality of model −1. Silhouette Analysis 2. Davis-Bouldin Index 3. Dunn Index
1. Silhouette Analysis
Silhouette analysis used to check the quality of clustering model by measuring the distance between the clusters. It basically provides us a way to assess the parameters like number of clusters with the help of Silhouette score. This score measures how close each point in one cluster is to points in the neighboring clusters.
Analysis of Silhouette Score
The range of Silhouette score is [-1, 1]. Its analysis is as follows −
+1 Score − Near +1 Silhouette score indicates that the sample is far away from its neighboring cluster.
0 Score − 0 Silhouette score indicates that the sample is on or very close to the decision boundary separating two neighboring clusters.
-1 Score &minusl -1 Silhouette score indicates that the samples have been assigned to the wrong clusters.
The calculation of Silhouette score can be done by using the following formula −
=()/ (,)
Here, = mean distance to the points in the nearest cluster
And, = mean intra-cluster distance to all the points.
2. Davis-Bouldin Index
DB index is another good metric to perform the analysis of clustering algorithms. With the help of DB index, we can understand the following points about clustering model −
Weather the clusters are well-spaced from each other or not?
How much dense the clusters are?
We can calculate DB index with the help of following formula −
DB=1n∑i=1nmaxj≠i(σi+σjd(ci,cj))
Here, = number of clusters
σi = average distance of all points in cluster from the cluster centroid .
Less the DB index, better the clustering model is.
3. Dunn Index
It works same as DB index but there are following points in which both differs −
The Dunn index considers only the worst case i.e. the clusters that are close together while DB index considers dispersion and separation of all the clusters in clustering model.
Dunn index increases as the performance increases while DB index gets better when clusters are well-spaced and dense.
We can calculate Dunn index with the help of following formula −
D=min1≤i<j≤nP(i,j)mix1≤i<k≤nq(k)
Here, ,, = each indices for clusters
= inter-cluster distance
q = intra-cluster distance
Applications of Clustering
We can find clustering useful in the following areas −
Data summarization and compression − Clustering is widely used in the areas where we require data summarization, compression and reduction as well. The examples are image processing and vector quantization.
Collaborative systems and customer segmentation − Since clustering can be used to find similar products or same kind of users, it can be used in the area of collaborative systems and customer segmentation.
Serve as a key intermediate step for other data mining tasks − Cluster analysis can generate a compact summary of data for classification, testing, hypothesis generation; hence, it serves as a key intermediate step for other data mining tasks also.
Trend detection in dynamic data − Clustering can also be used for trend detection in dynamic data by making various clusters of similar trends.
Social network analysis − Clustering can be used in social network analysis. The examples are generating sequences in images, videos or audios.
Biological data analysis − Clustering can also be used to make clusters of images, videos hence it can successfully be used in biological data analysis.