K-Medoids Clustering – Algorithm
The K-medoids clustering algorithm can be summarized as follows −
- Initialize k medoids − Select k random data points from the dataset as the initial medoids.
- Assign data points to medoids − Assign each data point to the nearest medoid.
- Update medoids − For each cluster, select the data point that minimizes the sum of distances to all the other data points in the cluster, and set it as the new medoid.
- Repeat steps 2 and 3 until convergence or a maximum number of iterations is reached.
Implementation in Python
To implement K-medoids clustering in Python, we can use the scikit-learn library. The scikit-learn library provides the KMedoids class, which can be used to perform K-medoids clustering on a dataset.
First, we need to import the required libraries −
from sklearn_extra.cluster import KMedoids
from sklearn.datasets import make_blobs
import matplotlib.pyplot as plt
Next, we generate a sample dataset using the make_blobs() function from scikit-learn −
X, y = make_blobs(n_samples=500, centers=3, random_state=42)
Here, we generate a dataset with 500 data points and 3 clusters.
Next, we initialize the KMedoids class and fit the data −
kmedoids = KMedoids(n_clusters=3, random_state=42)
kmedoids.fit(X)
Here, we set the number of clusters to 3 and use the random_state parameter to ensure reproducibility.
Finally, we can visualize the clustering results using a scatter plot −
plt.figure(figsize=(7.5,3.5))
plt.scatter(X[:,0], X[:,1], c=kmedoids.labels_, cmap='viridis')
plt.scatter(kmedoids.cluster_centers_[:,0],
kmedoids.cluster_centers_[:,1], marker='x', color='red')
plt.show()
Example
Here is the complete implementation in Python −
from sklearn_extra.cluster import KMedoids
from sklearn.datasets import make_blobs
import matplotlib.pyplot as plt

# Generate sample data
X, y = make_blobs(n_samples=500, centers=3, random_state=42)# Cluster the data using KMedoids
kmedoids = KMedoids(n_clusters=3, random_state=42)
kmedoids.fit(X)# Plot the results
plt.figure(figsize=(7.5,3.5))
plt.scatter(X[:,0], X[:,1], c=kmedoids.labels_, cmap='viridis')
plt.scatter(kmedoids.cluster_centers_[:,0],
kmedoids.cluster_centers_[:,1], marker='x', color='red')
plt.show()
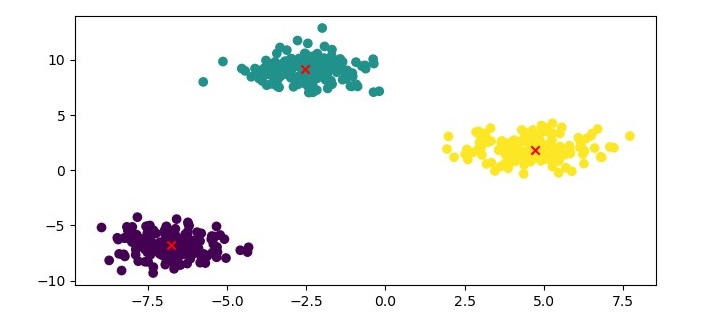
Output
Here, we plot the data points as a scatter plot and color them based on their cluster labels. We also plot the medoids as red crosses.
K-Medoids Clustering – Advantages
Here are the advantages of using K-medoids clustering −
- Robust to outliers and noise − K-medoids clustering is more robust to outliers and noise than K-means clustering because it uses a representative data point, called a medoid, to represent the center of the cluster.
- Can handle non-Euclidean distance metrics − K-medoids clustering can be used with any distance metric, including non-Euclidean distance metrics, such as Manhattan distance and cosine similarity.
- Computationally efficient − K-medoids clustering has a computational complexity of O(k*n^2), which is lower than the computational complexity of K-means clustering.
K-Medoids Clustering – Disadvantages
The disadvantages of using K-medoids clustering are as follows −
- Sensitive to the choice of k − The performance of K-medoids clustering can be sensitive to the choice of k, the number of clusters.
- Not suitable for high-dimensional data − K-medoids clustering may not perform well on high-dimensional data because the medoid selection process becomes computationally expensive.
Leave a Reply